It's important to understand some of the advantages of JIRA as well as how storypoints and estimations relate and the best way to estimate how long it can take a team to work through different aspects of a project.
Why JIRA:
Stories vs Tasks
User stories are in the product backlog which is a ranked list of product backlog items also known as (PBIs). Stories represent the scope of the product and are identified during the kickoff with the client. Tasks can be identified during sprint planning and become part of the sprint backlog.
A user story is typically a functionality that will be visible to end users. Developing a user story will usually involve a programmer and tester, perhaps a user interface designer or analyst, perhaps a database designer, or others..
A task on the other hand, is typically something such as a code assignment, a design task, creation of test data for such-and-such, automate that, and so on. These tend to be things done by one person.
Bottom Line: A task must be written by the team and it should represent a piece of a story. I suggest we leave the tasks creation to the person who will be working on it. If this is the case we have to request to whom created the task to relate it with the story that is created. If a story was estimated in 8 hours the related task should not last more than 8 hours.
Now that we know the difference between a story point and a task let’s dive into the story points and how to estimate time using story points versus tasks.
Advantages of estimating with story points:
Why should we estimate with hours?
How to measure the story points in JIRA:
If we followed the above steps we could have the following in JIRA:

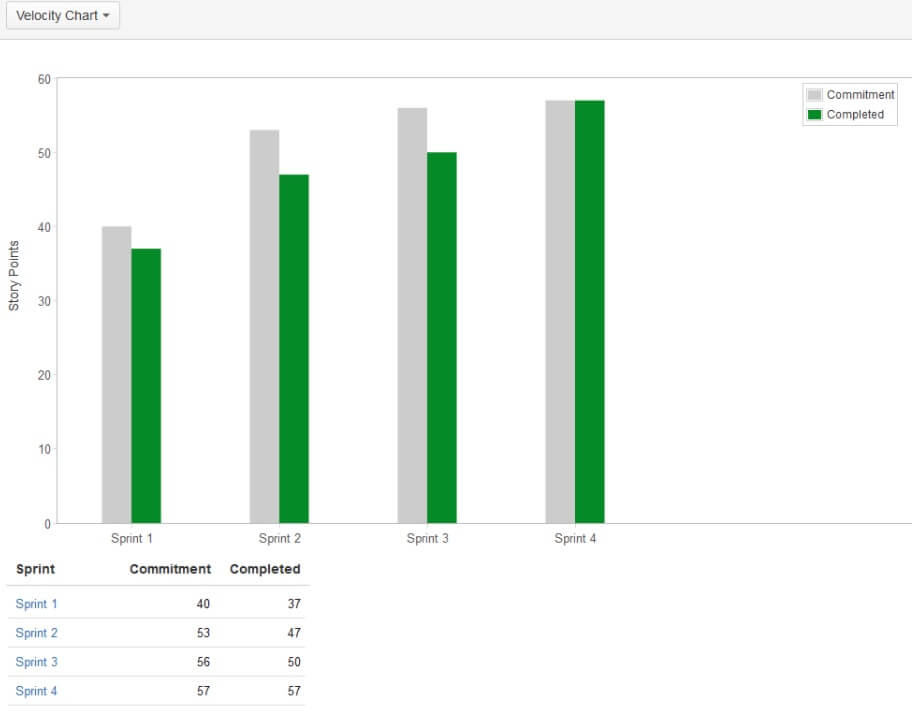
Velocity Chart:
A velocity chart is a graphic representation of what the team was committed to do and what was actually completed along sprints.

After a few sprints the velocity of a scrum team will most likely be predictable and will show the accurate estimation of the time needed until all entries in the scrum product backlog will be completed. If the velocity of a scrum team is e.g. 50 story points and the total amount of remaining work is 220, we can predict that we need about 5 sprints to complete all stories in the backlog.
Tip: See how the Story Points and Completed Stories get increased in time. This is because the team is going through a learning curve satisfactorily. In this case the dev team completion average is 40 Story Points.
What does a velocity chart represent?
The velocity chart shows how the team is performing during the project. What we expected is exactly what the graphics shows above in an ideal scenario. Therefore we can notice which team performs better than others and who individually inside the project is not performing as much we want.
Scrum Burndown Chart:
The scrum burndown chart is a visual measurement tool that shows the completed work per day against the projected rate of completion for the current project release.

Its purpose is to enable that the project is on the track to deliver the expected solution within the desired schedule. As a definition of this chart we can way that the burndown chart displays the remaining effort for a given period of time.
General breakdown of the burndown chart should consist of:
- X axis to display working days
- Y axis to display remaining effort
- Ideal effort as a guideline
- Real progress of effort

The biggest lesson we have learned is that you should not equate story points to hours in JIRA. Even though you know that a story point is closely tied to effort and effort equals time. It is important to realize that you should not equal the two.