
Mobomo webinars-now on demand! | learn more.

Alright, so your big data infrastructure is up and running. You've collected and analyzed gigabytes, terabytes, maybe even petabytes of data and now you'd like to visualize your data on desktop PCs, tablets, and smart phones.

How do you go about doing this? Well, let me show you. Visualizing big data, in many cases, isn't far from visualizing small data. At a high level, big data when summarized/aggregated, simply becomes smaller data.

In this post, we'll focus on transforming big data into smaller data for reporting and visualization by discussing the ideal architecture, as well as present a case study.

Architecture: Frontend (data visualization)

On the front end, we utilize responsive design with a single code base to support desktop, tablet, and mobile phones. For native mobile apps, we can utilize tools like PhoneGap or Adobe Cordova for responsive design; a process that significantly cuts down cost, shortens time to market, and is a great option for business apps.

Here are two popular frontend approaches:

1. Server Side MVC:

Server side MVC (model view controller) has been the de facto standard for web app development for quite some time. It's mature, has a well established tool set (i.e Ruby on Rails), and is search engine friendly. The only downsides are it's less interactive and less responsive.

2. Client Side MVC:

Capitalizing on JavaScript for page rendering, apps developed on Client Side MVC are more responsive and interactive than server versions. At Intridea, we've found this method to be particularly suited for interactive data. In addition, referred to as single page applications, Client Side MVC, have the look and feel of a desktop app. Therefore, creating an ideal user experience that is highly responsive and requires minimal page refreshing.

Architecture: Backend (data storage and processing)

Typically 'big data' is collected through some kind of streaming APIs and stored in HDFS, HBase, Cassandra, or S3. Hive, Impala, and CQL can be used to query directly against the data. It's fairly convenient to query big data this way, however not efficient if data has to be queried frequently for reporting purposes.

In these situations, extracting aggregated data into smaller data may be the better solution. MongoDB, Riak, Postgres, and MySQL are good options for storing smaller data. Big data can be transformed into smaller data, using ETL (Extract, Transform, Load) tools, thus making it more manageable (e.g. realtime data can be aggregated to hourly, daily, or monthly summary data).

Note: For single page application, a restful API server is needed to access the aggregated data. Our favorite API Server is Ruby on Rails.

Case Study: American Bible Society

American Bible Society provides online access to 582 versions of the Bible in 466 languages through partnerships with publishers. With their javascript API generating billions of records every year, ABS needed help making sense of their data. Thus, we partnered with ABS to create ScriptureAnalytics, a site that gives insights into their vast collection of data.

Access to the Bible translations was provided via JavaScript APIs. The usage of the APIs was tracked at the verse level, along with ip location, timestamp, and duration. The raw usage data was collected through AWS Cloudfront (Apache log files) and stored on EC2 S3 and preprocessing/aggregation of stats was conducted via AWS Elastic Map/Reduce with Apache Pig and Hive.

ABS receives over 500 million tracking log entries from Cloudfront every year, including several bible verse views per entry. What's this amount to annually? About several billion views each year!

Intridea was asked to develop public and private dashboards for visualizing Bible readership stats in an interactive and responsive way. The public dashboard, scriptureanalytics.com, was developed for the general public to view summary level status and trends. While the private dashboard was for ABS and publishers to track individual translations, helping them be strategic on a multitude of levels.

The dashboards were developed as a responsive single page app with Rails/MongoDB as the backend, and Backbone.js, D3, Mapbox as the frontend. The app pulls aggregated hourly/daily stats (generated using Hive and Pig running on Elastic Map/Reduce Hadoop clusters against the raw data stored in S3) in the JSON format from S3 and stores them in MongoDB for fast query access. The dashboards pull data from MongoDB via Rails and use Backbone/D3/Mapbox to visualize the stats. We use MongoDB's aggregation framework to query the data stored in MongoDB.

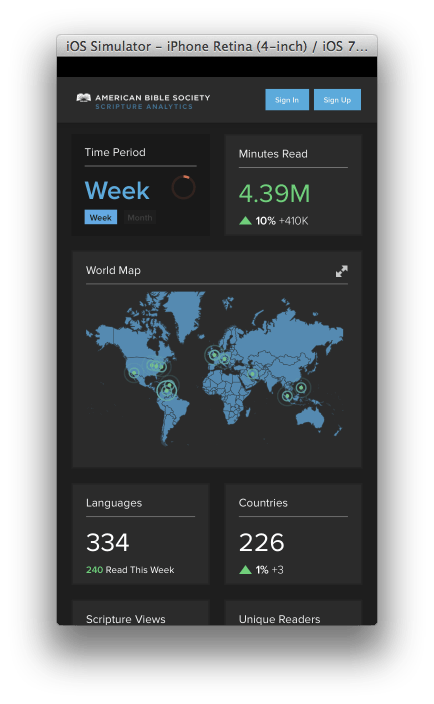
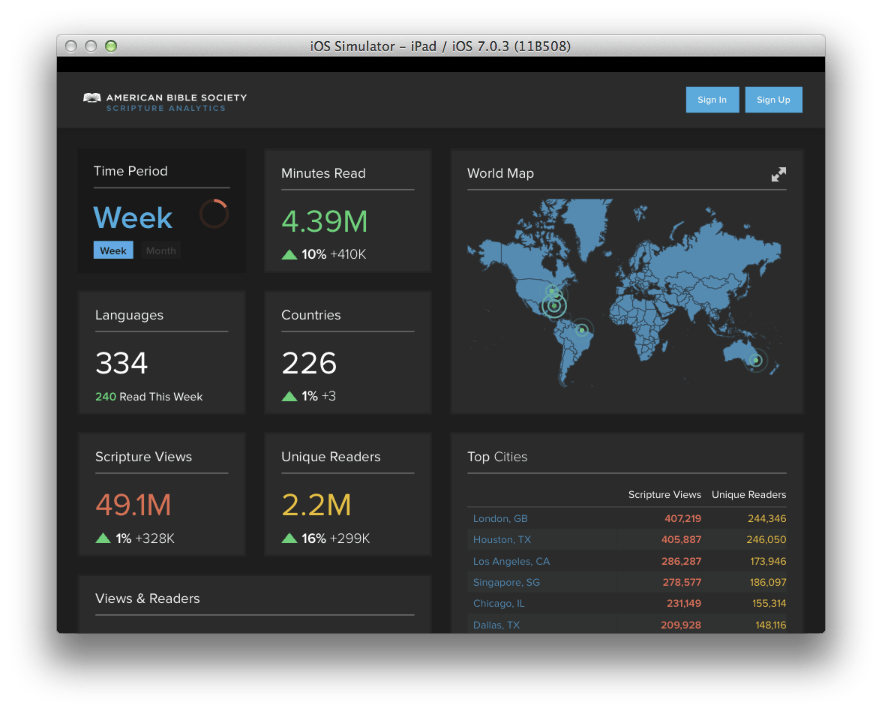
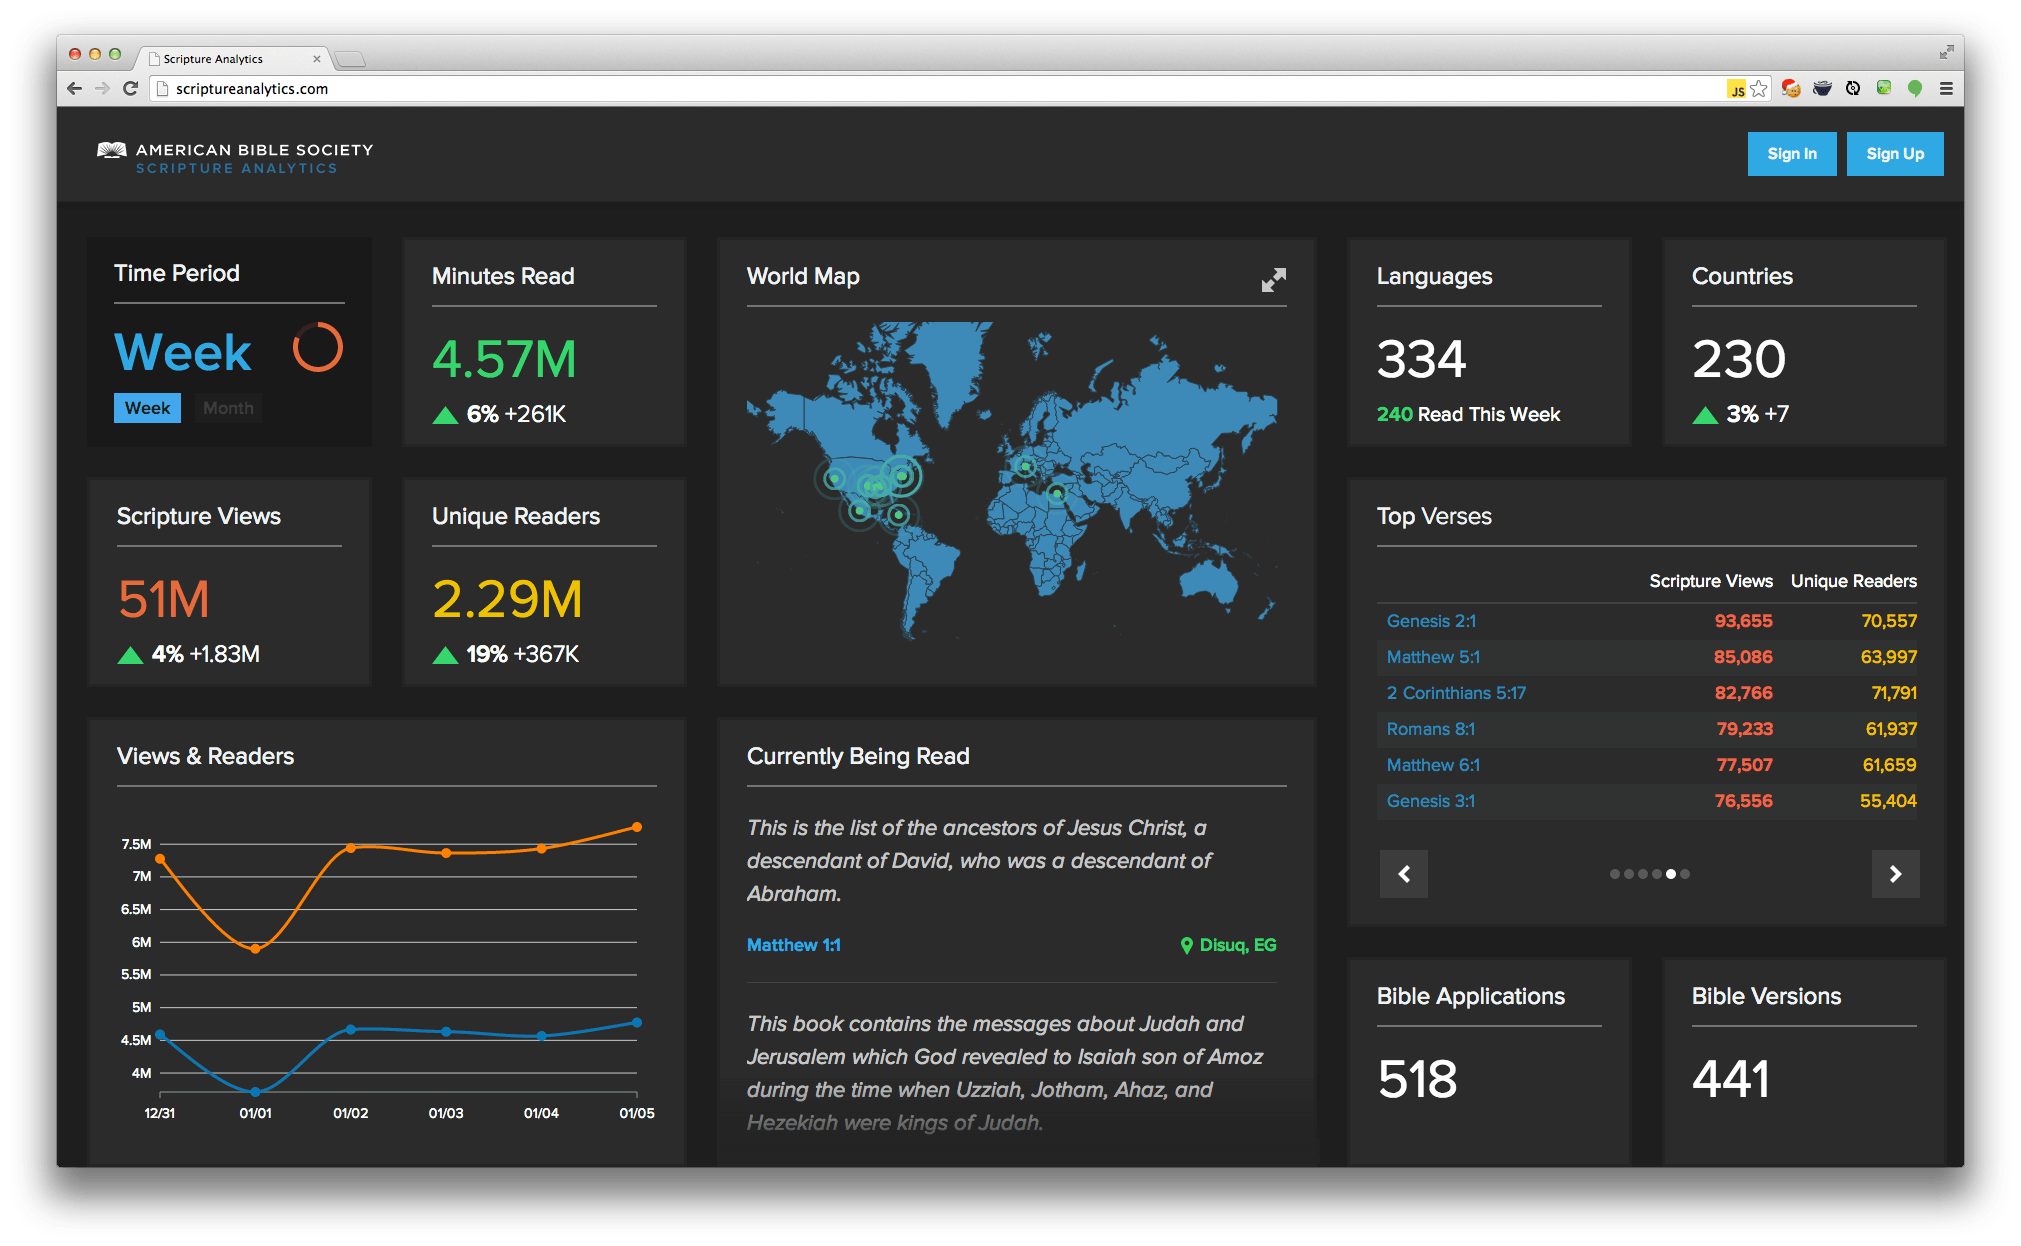
See screen shots below for iOS, iPad, and desktop PC:

Smart Phone

smart phone

Tablet

tablet

Desktop

desktop

Got any questions about visualizing big data on a small screen? Let us know!

Want to learn more? Check out the entire Big Data series below!

  • Big Data, Small Budget
  • Single Page Apps: Popular Client Side MVC Frameworks


Categories
Author

Processing big data requires a lot of CPU power and storage space. At the minimum, a cluster of powerful servers to process data in a distributed fashion is essential. Typically, the set up process can be very expensive. However, here are several relatively low cost options. Now, we're not talking petabytes big data at the major league scale, like FB or Twitter, but big enough that a traditional RDBMS - at 10s to 100s terabytes isn't enough.

We will be focusing on building a 10-node cluster for Hadoop. This process can also easily be adapted for other distributed computing platforms, such as Cassandra, Storm, or Spark.

  1. AWS Elastic Map/Reduce
  2. DIY using AWS EC2 instances
  3. DIY using PCs built with off-the-shelf components

AWS Elastic Map/Reduce

Amazon's Elastic Map/Reduce provides the easiest way to setup a Hadoop cluster, so if your budget allows, this is a great option. Setting up a Elastic M/R cluster is simple - just a few clicks from the AWS console, and you'll be up and running. Depending on your requirements, you may keep the cluster running all of the time, or you can fire up a cluster and terminate it when you're done with your data processing tasks.

The cost of the cluster is determined by the hardware configuration (type of server instances) and the software configuration (which Hadoop distribution: Amazon or MapR). Currently, Elastic Map/Reduce provides those applications: Hive, Pig, and Hbase.

Here are the costs of some commonly used EC2 instance types, except hs1.8xlarge - the most expensive instance so far, is listed here for reference. The full EC2 instance pricing list is available here.

For a 10-node cluster, the cost can be calculated using the AWS cost calculator

  • Pros: Easy to setup, can be lauched and terminated on demand
  • Cons: Expensive, limited choices of OS, Hadoop distro, and applications

For a 10-node m2.4xlarge cluster the monthly cost is $16,435. Also, you'll need to budget around 1/5 of that to cover network i/o and storage costs.

To process a petabyte worth of data, you'll need a 21-node hs1.8xlarge cluster, which costs close to $88,000/month.

DIY Using AWS EC2 Instances

AWS Elastic Map/Reduce adds management and software on top of the instance costs. If you want to avoid those cost, you can build your cluster using individual EC2 instances, and install and configure the cluster software yourself.

  • Pros: Relatively cheaper, install any OS, Hadoop distro, and applications
  • Cons: Need to manually install and manage the cluster

For a 10-node m2.4xlarge cluster the monthly cost is $11,800. Also, you'll need to budget around 1/5 of that to cover network i/o and storage costs, plus labor and software licensing costs.

If you don't plan to set up a permanent cluster, that's available 24/7, you can use spot instances to reduce cost. For permanent clusters, using reserved instances can lower your costs, you can find more details here.

To process a petabyte worth of data, you'll need a 21-node hs1.8xlarge cluster, and it will cost close to $70,000/month.

DIY Using Servers Built with Off-The-Shelf Components

Your lowest cost option would be a complete DIY. Here's the current pricing for components and total cost for a mid-to-high end single server (more or less equivalent to EC2 m2.4xlarge, with faster CPU, much more disk space including fast SSD, but less memory):

Sample configurations from low to high:

Cost of a 10-node Off-The-Shelf Servers:

  • Pros: Cheapest, install any OS, Hadoop distro, utilizes physical hardware
  • Cons: Must manually install and manage the cluster and physical hardware

So, a 10-node cluster similar to m2.4xlarge costs around $15,000 (with a much larger 45TB capacity), and a lower end setup equivalent to a 10 m2.2xlarge node cluster costs around $10,000 (with a much larger 22TB capacity)

To process a petabyte worth of data, you'd need a 63-node cluster with the high end servers, and it will cost close to $200,000.

Choosing a Hadoop Distribution

You can choose a Hadoop distribution from one of the following competing offerings, they are all pretty good and easy to setup on a cluster, so anyone of those should more or less satisfy your big data needs:

Cloudera CDH4

Applications included: DataFu, Flume, Hadoop, HBase, HCatalog, Hive, Hue, Mahout, Oozie, Parquet, Pig, Sentry, Scoop, Whirr, Zookeeper, Impala

Hortonworks HDP

Applications included: Core Hadoop(HDFS, MapReduce, Tez, YARN), Data Services(Accumulo, Flume, HBase, HCatalog, Hive, Mahout, Pig, Sqoop, Storm), Operational Services(Ambari, Falcon, Knox Gateway, Oozie, ZooKeeper)

MapR

Applications included: HBase, Pig, Hive, Mahout, Cascading, Sqoop, Flume and more

Resource Links

Other distributed computing environments worth checking out:

Categories
Author
1
Subscribe to Elastic Map Reduce